NBA Storylines: Tracking Usage and Time of Possession Trends for Players this Season
Players are embracing new responsibilities, whether it be with a different team or within the same organization. These new roles can lead to significant changes in their usage rate and time of possession, potentially catapulting them to new heights or causing a decline in their performance.
1. Usage rate jumps
Biggest jump in usage rate, 2023-24 to ’24-25
2023-242024-25Diff.PlayerUSGTS%USGTS%USGTS%James Harden20.2%61.2%28.3%53.2%+8.1%-8.0%
Trey Murphy III18.2%61.2%25.6%51.5%+7.4%-9.7%
Malik Beasley14.2%60.3%21.0%55.8%+6.8%-4.5%
Tre Mann18.3%55.9%25.1%55.8%+6.8%-0.1%
Norman Powell19.3%62.6%25.9%63.8%+6.6%+1.2%
Josh Okogie12.5%55.2%19.0%65.0%+6.5%+9.8%
Dyson Daniels12.3%52.9%18.6%52.4%+6.3%-0.5%
Noah Clowney13.7%62.6%20.0%50.8%+6.3%-11.8%
Grayson Allen14.3%67.9%20.5%56.8%+6.2%-11.1%
Gradey Dick16.7%54.6%22.6%56.3%+5.9%+1.7%
TS% = PTS / (2 * (FGA + (0.44 * FTA)))
Minimum 250 minutes played last season and 100 minutes played this season (278 players)
Usage rate is the percentage of his team’s possessions that a player ends (via field goal attempts, turnovers and trips to the line) while he’s on the floor. The league leader through Wednesday is LaMelo Ball at 36.2%.
True shooting percentage measures scoring efficiency (Ty Jerome is the current leader among players with at least 75 field goal attempts), and can often go down when a player sees a jump in usage rate.
A couple of notes…
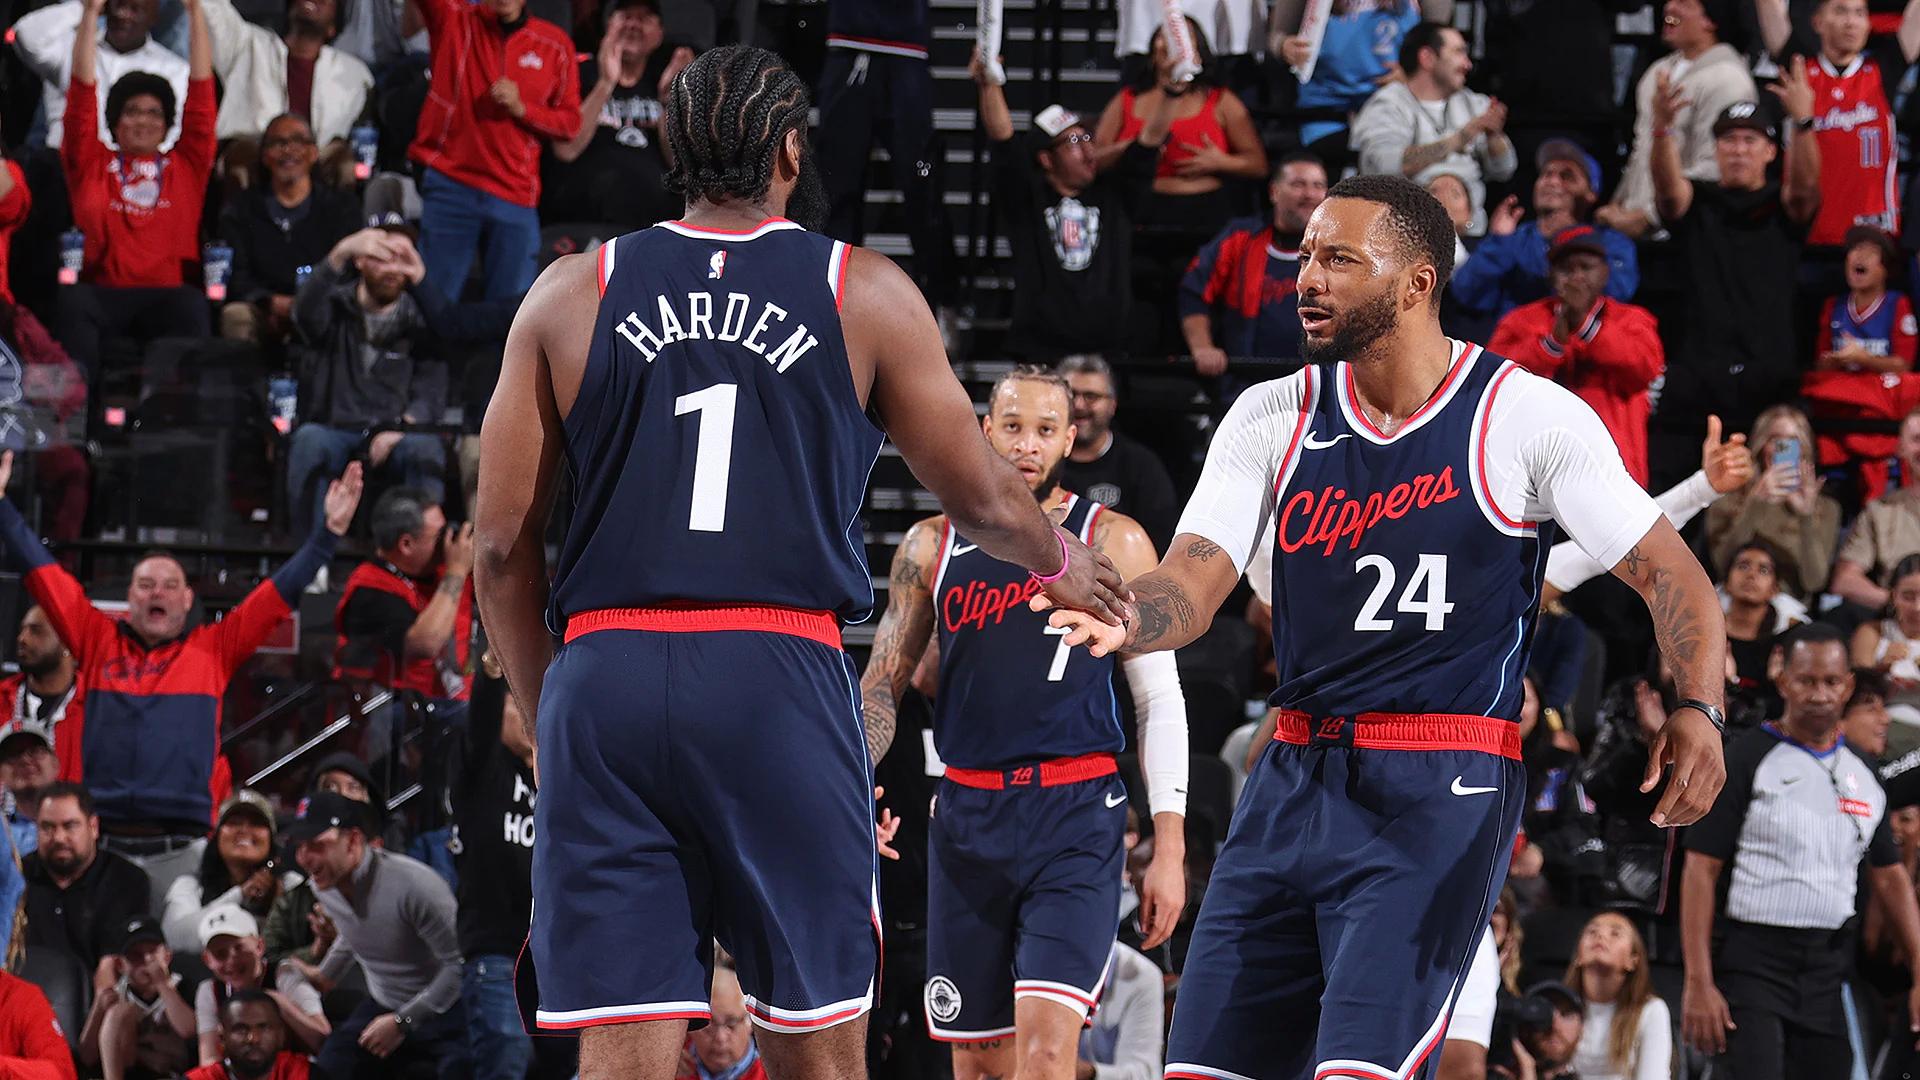
James Harden‘s usage rate of 20.2% last season (his first with the Clippers) was a drop from 24.7% the season prior (his lone full season with the Sixers) and his lowest rate since his second season in the league. With Paul George gone and Kawhi Leonard having yet to play, Harden has obviously been asked to do more offensively. But his efficiency has suffered, and his true shooting percentage of 53.8% is the lowest mark of his career.Norman Powell, meanwhile, has done well with the increased playing time (an additional 7.2 minutes per game) and increased usage in LA, registering the highest true shooting percentage of his career (63.8%).2. Usage rate drops
Here’s the other end of the list …
Biggest drop in usage rate, 2023-24 to ’24-25
2023-242024-25Diff.PlayerUSGTS%USGTS%USGTS%Alec Burks23.4%53.6%11.6%65.8%-11.8%+12.2%
Shake Milton17.3%49.9%10.2%56.7%-7.1%+6.8%
Tim Hardaway Jr.22.0%54.2%15.1%61.8%-6.9%+7.6%
Jake LaRavia20.1%54.0%14.1%57.6%-6.0%+3.6%
Terry Rozier25.3%55.5%19.4%50.5%-5.9%-5.0%
Mikal Bridges23.8%56.0%18.0%56.2%-5.8%+0.2%
Brandon Boston Jr.24.0%47.6%18.6%54.2%-5.4%+6.6%
Caris LeVert22.4%52.4%17.3%66.3%-5.1%+13.9%
Gary Trent Jr.19.5%54.8%14.5%48.8%-5.0%-6.0%
Cam Reddish12.3%50.4%7.4%72.8%-4.9%+22.4%
The Heat rank higher offensively (15th) than they did last season (21st), though Terry Rozier has struggled on offense. His true shooting percentage of 50.3% ranks 155th (though a few spots ahead of teammate Bam Adebayo) among 175 players with at least 100 field goal attempts.Caris LeVert has had a smaller role but has been a big part of the Cavs’ early-season success. His career-best true shooting percentage of 66.3% includes 45.8% shooting from 3-point range, and Cleveland has outscored its opponents by an amazing 21.2 points per 100 possessions in his 317 minutes.3. Time of possession jumps
Usage rate looks at the end of a possession, while time of possession (tracked by Second Spectrum) tells us how much a player has the ball in his hands.
Here are the players who’ve seen the biggest jumps in time of possession, as a percentage of the minutes that they’ve been on the floor …
Biggest jump in time of possession, 2023-24 to ’24-25
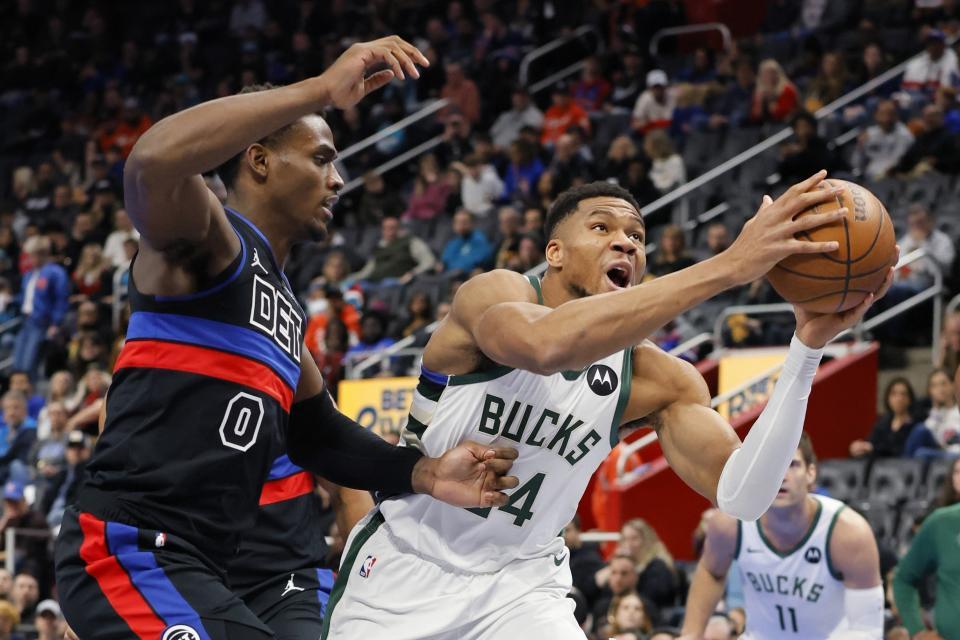
2023-242024-25Diff.PlayerPer gameTOP%Per gameTOP%Per gameTOP%Patty Mills0.64.6%2.214.6%+1.6+10.0%Jalen Suggs2.48.7%4.916.6%+2.6+7.9%Brandon Boston Jr.0.87.2%4.314.6%+3.5+7.4%Scottie Barnes3.610.4%5.817.2%+2.1+6.8%Anthony Black1.58.8%3.915.4%+2.4+6.6%RJ Barrett2.47.6%4.713.7%+2.3+6.1%Jaden Ivey2.89.6%4.614.2%+1.8+4.6%Paul George3.39.9%4.114.3%+0.8+4.4%Jose Alvarado2.111.3%4.015.6%+1.9+4.3%Giannis Antetokounmpo4.713.3%6.217.6%+1.5+4.3%Per game = Time of possession per game
TOP% = Time of possession / total minutes on the floor
Minimum 250 minutes in 2023-24 and 100 minutes in 2024-25
via Second Spectrum tracking
4. Time of possession drops
Biggest drop in time of possession, 2023-24 to ’24-25
2023-242024-25Diff.PlayerPer gameTOP%Per gameTOP%Per gameTOP%Craig Porter Jr.2.520.0%0.98.4%-1.6-11.6%Devin Booker6.217.2%4.411.9%-1.8-5.3%Bradley Beal4.714.1%3.18.9%-1.6-5.1%Spencer Dinwiddie3.713.2%1.58.7%-2.3-4.5%Luka Dončić8.322.3%6.617.9%-1.8-4.3%Jamal Murray5.918.9%5.414.9%-0.5-4.0%Cody Martin2.910.9%1.77.0%-1.2-3.9%Terry Rozier5.917.5%4.313.6%-1.5-3.9%Tyrese Haliburton6.520.2%5.716.4%-0.8-3.8%Darius Garland6.619.8%4.916.1%-1.7-3.7%The Phoenix Suns have a point guard, so Devin Booker and Bradley Beal have been handling the ball less. But Booker has been less efficient, registering a true shooting percentage of 57.7%, his lowest mark in the last three seasons and down from 61.1% last season.Luka Dončić led the league in time of possession for three straight seasons before finishing second (to Jalen Brunson) last season at 8.3 minutes per game. This season, he ranks ninth at just 6.5 minutes per game, by far his lowest mark of the last six seasons and tied with his mark from his rookie season (when he averaged 4.5 fewer minutes per game than he has this season). Interestingly, Kyrie Irving has also seen a drop in time of possession, with one difference being new Mavs forward Naji Marshall (1.9 minutes per game) handling the ball much more than Derrick Jones Jr. (0.7 minutes per game) did last season.* * *
John Schuhmann is a senior stats analyst for NBA.com. You can e-mail him here, find his archive here and follow him on X.
The views on this page do not necessarily reflect the views of the NBA, its clubs or Warner Bros. Discovery.
RELATED STORIES


LATEST NEWS
